Jack, a regular customer for a retail business, calls the customer service department for the nth time and explodes to let out his steam. That’s because Jack’s problem hasn’t been resolved yet. Does this overt action ring the ‘Customer Churn’ warning bells?
Cynthia who shops at the same retail store regularly laps up every promotion the retailer runs – flash sale offering 30% off on an item or the Buy One Item and Get One Free promotion or the likes – Of late, frequency of cashing in on promotions has declined on her part wherein her purchase amount has also been decreasing with every purchase. Is this a covert action signaling ‘Customer Churn’?
Beyond the obvious, there are feint churn signals lying in wait – change in customer tone in an email message for instance. Then capturing these feint churn signals means using artificial intelligence and machine learning to detect signals of customer churn, as early as it takes, to nip churn in the bud and increase the chances of nurturing yet another profitable customer.
Where it augurs well for businesses to retain customers and increase Customer Lifetime Value, and pays off when businesses detect at-risk customers to cut customer churn, enterprises make the most out of data, segmentation techniques and machine learning algorithms to put the best foot forward in reducing customer churn.
Starting with data
Right, relevant datasets set the precedent for achieving customer churn prediction accuracy. As it turns out, most critical data is the ‘churn’ data or the customers who had defected – Nailing down the defection period, or specific periods, when customers stopped buying or using the services is critical to solving this problem.
Further, datasets including customer age, gender, address services that customers have signed up for, products bought, frequency of purchase, and time period of their association with a company, payment method, billing, calls customers have made to customer service, customer issues and resolutions among others come good for this purpose.
Who are at-risk customers?
Customer behavior is the cue that an organization takes to identify at-risk customers. This means turning the lens on behavior data – How frequently a customer buys, what products customers buy, are there any specific sources used for buying, any specific sources sought for product or pricing information, calls made by customers to customer service, preferences to promotional offers and other such data – is a step towards unearthing behavioral patterns resulting in happy customers and customers who are about to churn.
When behavioral patterns leading to customer churn are unearthed, customer segmentation shows the way forward to identify at-risk customers. Here, segmentation is based on lost customers, prompting the need for At-risk Customer Profiling. In this case, it is about reading trends and patterns, unearthing factors that have led to customer churn. A segmentation tree serves well to throw light on how different factors, behaviors and attributes trigger loss of customers
What has caused customers to churn?
There are different factors that trigger customer churn. For instance, there are mobile users who get model-fatigued into buying another new model. When Gel paste was introduced by a manufacturer in India in the 1980s, customers deserted the then leading white toothpaste manufacturer.
There are customers who think a brand has let them down, customers not happy with a brand’s service or a customer who is enticed by competition, in turn, creating the chasm between customer and the brand and giving way for a churn to happen. What causes churn is the impetus to find out factors leading to customer churn. Reasons are aplenty when it comes to customers defecting to the other side.
Can we pin down factors leading to customer churn?
Being affirmative here means taking advantage of Exploratory Data Analysis. Historical data becomes pivotal to unearth factors causing churn and to know how big they play a role in causing customer churn.
For a leading 3PL solutions provider that wanted to know why customers are defecting and what are the major triggers causing customer churn, pinning down critical datasets proved crucial. The company turned its focus on attributes that could help them understand why customers churned.
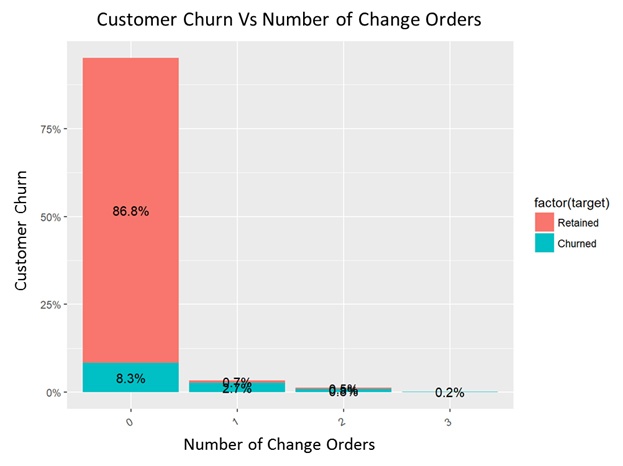
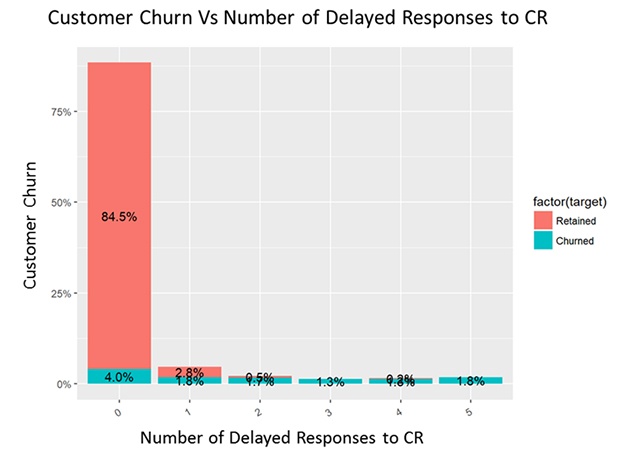
Some important attributes covered for Exploratory Data Analysis included invoices, order frequency and accuracy, change orders, miles range, customer service calls, visibility, responses to customer requests and price parity. Historical datasets were used to construct a series of plots where customer churn could be visualized against the most significant attributes.


What’s the best-fit model for making accurate churn prediction?
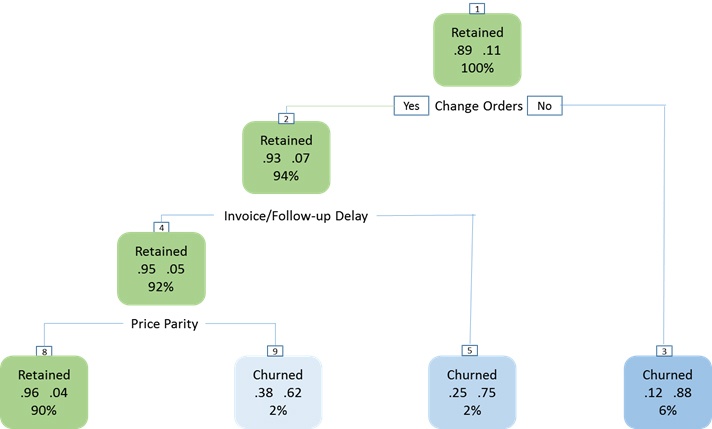
In the case of 3PL solutions provider, it turns out to be a classification problem. To deal with this, Classification and Regression Tree (CART) emerged as the ideal model for assuring actionable insights by way of providing class probability of individual instance.
For illustration, let’s focus on the most critical variables for plotting trees include ‘Change Orders, ‘Invoice/Follow-up Delay’, ‘Price Parity’, ‘Responses to Customer Requests’ and ‘Revenue Decrease”.

Did the model output give away ‘How & What’ of customer churn?
The 3PL solutions provider was able to unearth prime reasons that triggered customer churn, strengthen specific areas to reduce customer churn. The findings threw light on how churn had happened and what % of customers churned because of what reasons. The most significant of the observations was that 38% of customers churned owing to factors including price parity, delay in invoicing and follow-ups and occurrences of change orders.
Like Jack and Cynthia, there could be a Christina and a Mark waiting to defect to a competitor. That only strengthens enterprises’ resolve to detect the slightest hint of churn, leveraging data, artificial intelligence and machine learning algorithms. As enterprises close in on predicting likely churners, data also has nuggets to find ways to drive customer retention.


