The discussions on Business Intelligence or Data Warehouse solutions seem to be always around historical, sickness pharm integrated, order and non-volatile data. Is it worth spending huge budgets on those BI solutions?
If we look at the way most of the Business Intelligence projects are implemented and how they have been utilized by the business users we are totally ignoring the fact that BI is not just about data and visualizations alone. The crux is – Are we aligning the KPI’s with the business strategy? And how do we track our KPIs beyond visualization?
Assuming you have done an analysis on the data provided by the Business Intelligence system and you have taken some kind of a decision, are you tracking on how it has impacted your bottom line? The answer in most of the cases is a NO. So why do you need a Business Intelligence system just to have the integrated data? In most of the cases, organizations that have implemented BI are stopping at a level where they look at the data, analyse, and forget it. Unfortunately we are not using the BI data beyond this scope. At the end of the day, organizations want BI to improve the bottom line. So what do we need to do to get benefited with the data that you have in the system?
Strategy Maps & Balanced Scorecard
By using the BI data we should be able to build the strategy map forms and frameworks which will enable us to connect to atomic level strategies to specific business areas and initiatives and their dependent KPIs & metrics. We should be able to come up with strategy maps to model objectives and tracks their linkages down to dependant KPIs. We should be able to analyse the operational drivers and also learn the initiatives that are impacting our goals.
Balanced scorecard framework analyse performance across financial, customer, internal, and external perspectives by offering you an approach to translate strategy into operational terms and to seamlessly drill down the objectives, and KPIs to metrics. It should also assists you to track Critical success factor (CSF), set exception criteria, and track through proactive alerts/highlights.
Scorecards makes it possible for the business users and senior management to come up with scoring mechanisms on-the-fly to track any number of metrics in a report or even specify criteria to arrive at complex scorecards. Based on the ranking, you can then analyse your actions to achieve your goals/targets. Example, using measures like Net Sales $ and Margin Contribution % together will help you evaluate top performing stores in a store performance report.
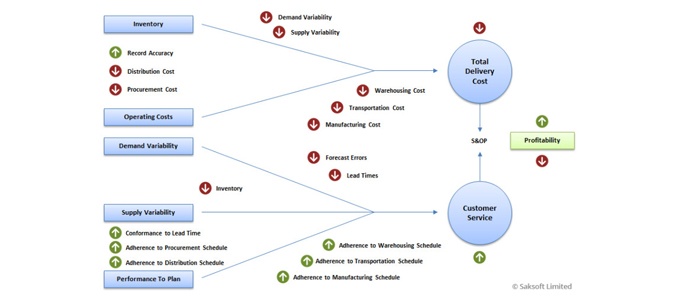
Below is the diagram which will depict on how you can use the Business Intelligence data and how it can be represented in a more meaningful way to the business users rather than the typical visualizations.


