[fusion_builder_container type=”flex” hundred_percent=”no” hundred_percent_height=”no” min_height_medium=”” min_height_small=”” min_height=”” hundred_percent_height_scroll=”no” align_content=”stretch” flex_align_items=”flex-start” flex_justify_content=”flex-start” flex_column_spacing=”” hundred_percent_height_center_content=”yes” equal_height_columns=”no” container_tag=”div” menu_anchor=”” hide_on_mobile=”small-visibility,medium-visibility,large-visibility” status=”published” publish_date=”” class=”” id=”” margin_top_medium=”” margin_bottom_medium=”” margin_top_small=”” margin_bottom_small=”” margin_top=”” margin_bottom=”” padding_top_medium=”” padding_right_medium=”” padding_bottom_medium=”” padding_left_medium=”” padding_top_small=”” padding_right_small=”” padding_bottom_small=”” padding_left_small=”” padding_top=”20px” padding_right=”30px” padding_bottom=”20px” padding_left=”30px” link_color=”” link_hover_color=”” border_sizes_top=”” border_sizes_right=”” border_sizes_bottom=”” border_sizes_left=”” border_color=”” border_style=”solid” box_shadow=”no” box_shadow_vertical=”” box_shadow_horizontal=”” box_shadow_blur=”0″ box_shadow_spread=”0″ box_shadow_color=”” box_shadow_style=”” z_index=”” overflow=”” gradient_start_color=”” gradient_end_color=”” gradient_start_position=”0″ gradient_end_position=”100″ gradient_type=”linear” radial_direction=”center center” linear_angle=”180″ background_color=”” background_image=”” skip_lazy_load=”” background_position=”center center” background_repeat=”no-repeat” fade=”no” background_parallax=”none” enable_mobile=”no” parallax_speed=”0.3″ background_blend_mode=”none” video_mp4=”” video_webm=”” video_ogv=”” video_url=”” video_aspect_ratio=”16:9″ video_loop=”yes” video_mute=”yes” video_preview_image=”” render_logics=”” absolute=”off” absolute_devices=”small,medium,large” sticky=”off” sticky_devices=”small-visibility,medium-visibility,large-visibility” sticky_background_color=”” sticky_height=”” sticky_offset=”” sticky_transition_offset=”0″ scroll_offset=”0″ animation_type=”” animation_direction=”left” animation_speed=”0.3″ animation_offset=”” filter_hue=”0″ filter_saturation=”100″ filter_brightness=”100″ filter_contrast=”100″ filter_invert=”0″ filter_sepia=”0″ filter_opacity=”100″ filter_blur=”0″ filter_hue_hover=”0″ filter_saturation_hover=”100″ filter_brightness_hover=”100″ filter_contrast_hover=”100″ filter_invert_hover=”0″ filter_sepia_hover=”0″ filter_opacity_hover=”100″ filter_blur_hover=”0″][fusion_builder_row][fusion_builder_column type=”1_1″ layout=”1_1″ align_self=”auto” content_layout=”column” align_content=”flex-start” valign_content=”flex-start” content_wrap=”wrap” spacing=”” center_content=”no” link=”” target=”_self” min_height=”” hide_on_mobile=”small-visibility,medium-visibility,large-visibility” sticky_display=”normal,sticky” class=”” id=”” type_medium=”” type_small=”” order_medium=”0″ order_small=”0″ dimension_spacing_medium=”” dimension_spacing_small=”” dimension_spacing=”” dimension_margin_medium=”” dimension_margin_small=”” margin_top=”” margin_bottom=”” padding_medium=”” padding_small=”” padding_top=”” padding_right=”” padding_bottom=”” padding_left=”” hover_type=”none” border_sizes=”” border_color=”” border_style=”solid” border_radius=”” box_shadow=”no” dimension_box_shadow=”” box_shadow_blur=”0″ box_shadow_spread=”0″ box_shadow_color=”” box_shadow_style=”” background_type=”single” gradient_start_color=”” gradient_end_color=”” gradient_start_position=”0″ gradient_end_position=”100″ gradient_type=”linear” radial_direction=”center center” linear_angle=”180″ background_color=”” background_image=”” background_image_id=”” background_position=”left top” background_repeat=”no-repeat” background_blend_mode=”none” render_logics=”” filter_type=”regular” filter_hue=”0″ filter_saturation=”100″ filter_brightness=”100″ filter_contrast=”100″ filter_invert=”0″ filter_sepia=”0″ filter_opacity=”100″ filter_blur=”0″ filter_hue_hover=”0″ filter_saturation_hover=”100″ filter_brightness_hover=”100″ filter_contrast_hover=”100″ filter_invert_hover=”0″ filter_sepia_hover=”0″ filter_opacity_hover=”100″ filter_blur_hover=”0″ animation_type=”” animation_direction=”left” animation_speed=”0.3″ animation_offset=”” last=”true” border_position=”all” first=”true”][fusion_text columns=”” column_min_width=”” column_spacing=”” rule_style=”default” rule_size=”” rule_color=”” content_alignment_medium=”” content_alignment_small=”” content_alignment=”” hide_on_mobile=”small-visibility,medium-visibility,large-visibility” sticky_display=”normal,sticky” class=”” id=”” margin_top=”” margin_right=”” margin_bottom=”” margin_left=”” font_size=”” fusion_font_family_text_font=”” fusion_font_variant_text_font=”” line_height=”” letter_spacing=”” text_color=”” animation_type=”” animation_direction=”left” animation_speed=”0.3″ animation_offset=””]
You need to address the rising concern of the black-box AI problem, now that, AI maturity is spreading across industries. Here’s one healthcare institution’s black box AI scenario that better explains the need for Explainable AI. While AI and Image processing techniques are used to classify cancer types, would an Oncologist just treat a patient based on the model’s predictions?
Not without understanding how the deep learning model arrived at the prediction, came to its conclusions. Today, in goes data, and out comes predictions and explanations from the ML model. With the Explainable AI, you can validate the decision rationale of ML models. How can you implement XAI to solve the black box AI problem?
Here’s how you can implement Explainable AI with SHAP framework.
Building XAI models with SHAP framework
To start with, there are Explainable AI tools and frameworks such as the SHAP, LIME and What-if tool that help us understand the workings of a machine learning model. SHAP is one framework that has shown the way to enhance reliability of ML models and explain model behaviour. You can use SHAP framework, or the SHapley Additive exPlanations (SHAP) that comes with explainers and adopts model-agnostic method to explain how different features influence the outcome thrown by the machine learning model.
Sample scenario for better SHAP framework understanding
Let us consider the ML task of predicting product sales. You model product sales prediction, and let’s say that we build using Multiple Linear Regression. From the prediction, you gather that the model has predicted a sale of 700 units. Now, how do you explain the prediction result of this model?
SHAP framework is used to explain how the model arrived at the Predictive results. Tracing our way back to the product prediction, we also need to consider the average prediction for that product, which is say 950 units. How did each of the feature value contribute to the prediction (700 units) as compared to average prediction then helps understand the model behaviour.
Calculating Shapely value for a Feature
Using SHAP framework for Explainable AI means that the ML model you build can be explained using SHAP values. With the Shapley value, you can explain what every feature in the input data contributes to every prediction. For instance, in the case of Product sales prediction, let us assume that 5 features in the input data are brought into perspective.
The feature values here are Discount Rate 10%, Price, Free Delivery, Past Purchase, and Stock. Every feature contributes to this output of 700 – for example, Discount Rate 10% – 400, Free delivery – 150, Stock – 130, Price – -120 Past Purchase – 140 add up to give out the model output 700.
We need to calculate the Shapley value for each one of these features.
When we say Shapely value, we arrive at the average marginal contribution of a specific feature acquired using various possible coalitions. In this case, let’s consider the Shapley value of ‘Discount Rate 10%’. The possible coalitions for determining the Shapley value for Discount Rate 10% are taken into consideration, captured by the image below.
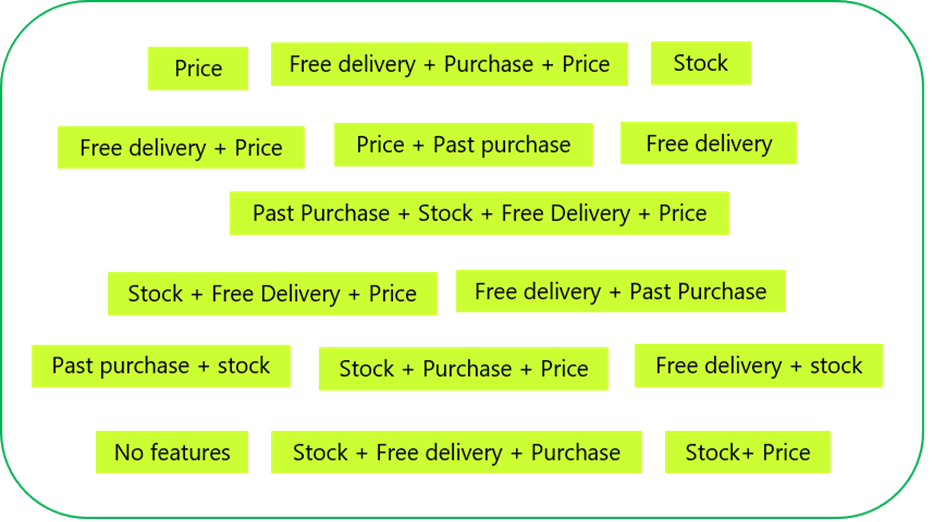
The product sale prediction is performed for every one of the coalitions captured above with Discount Rate 10% feature, as well as without that feature value. When you take the difference, you arrive at the marginal contribution. And when you arrive at the average pertaining to marginal contributions, you get the Shapley value.
The scenario covered the SHAP essentials through a Linear regression model. Does SHAP framework support other ML algorithms?
Aligning SHAP framework with ML algorithms
SHAP framework can be used for any ML algorithm. There is a SHAP Explainer supporting any and every machine learning algorithm. For instance, you can use the TreeExplainer() when you are building tree-based ML model. You can use DeepExplainer() in case you are building deep learning models. The key is to select the right explainer for a specific ML model. Say you are handling a regression problem, which is bucketed under Linear model, you can go in for the Linear Explainer.
Whether you are using Python or R, SHAP can be leveraged via different explainers to augment XAI and improve performance.
Improving transparency using SHAP Prediction Explainers
You can use different charts to explain individual predictions in terms of explaining how features impacted the ML model output.
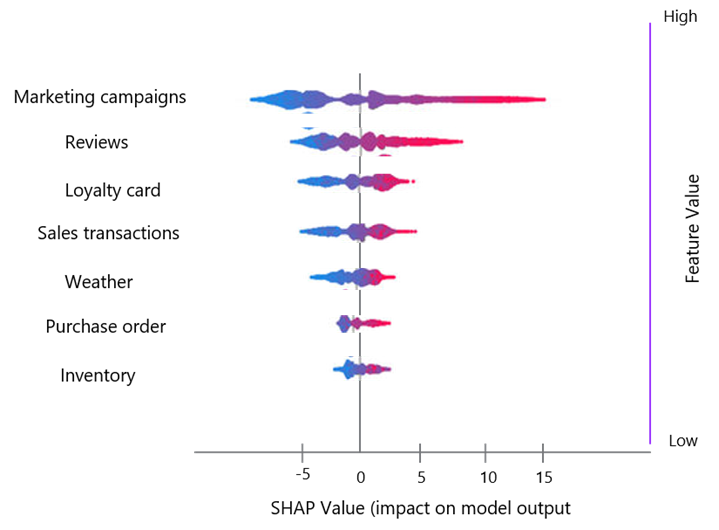
SHAP Summary Plot
In this chart, data is covered under a single plot enriched by easy-to-understand visualizations. The Summary Plot can be used to explain whether a specific feature produces higher or lower influence over the prediction. You can also capture feature relevance for every prediction.
Dependence Plot
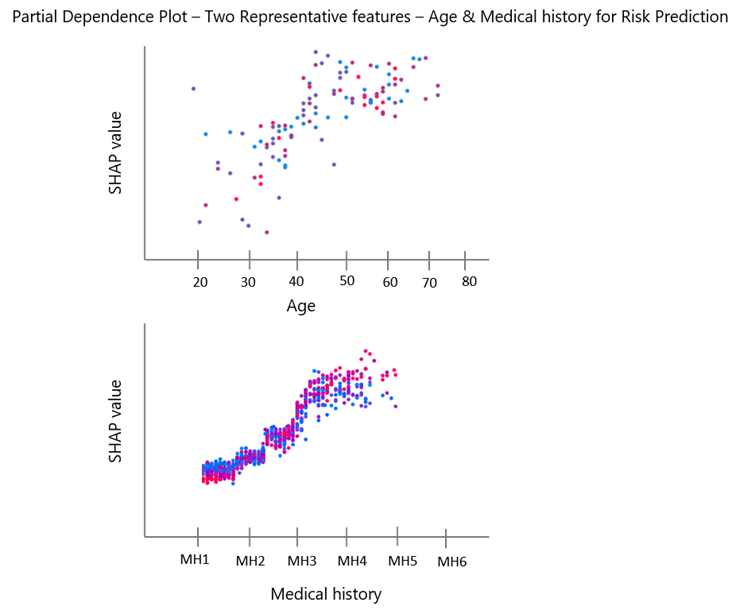
SHAP Dependence plot is used for plotting one feature vs another feature. This is represented via coloured dots highlighting the SHAP values of the two features, in two different colours. This chart offers value while you want to analyse feature importance and select features.
Decision Plot
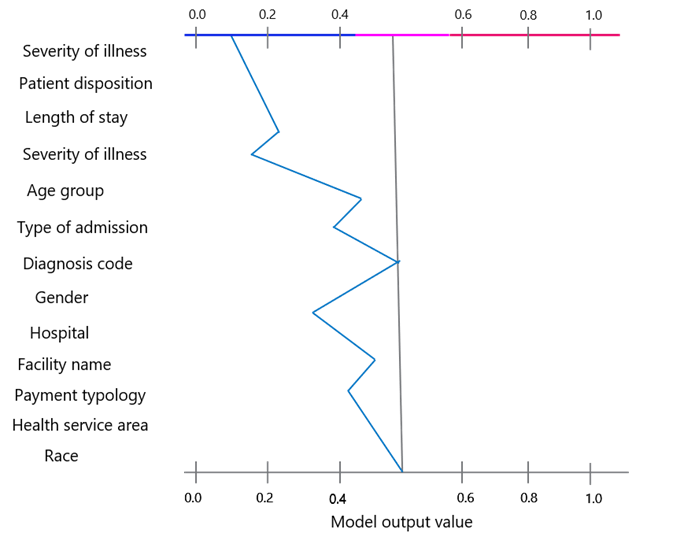
You can use Decision Plot to understand how ML models conclude or finalize decisions. Using this chart, you can rank features per their significant impact on the model outcomes.
Force Plot
You can use Force Plot when you want to analyse row-wise SHAP values, which are point numbers related to data in the rows pertaining to each feature. Leveraging Force Plot, you can focus on a single row and understand how the features were ranked in order to influence the prediction.
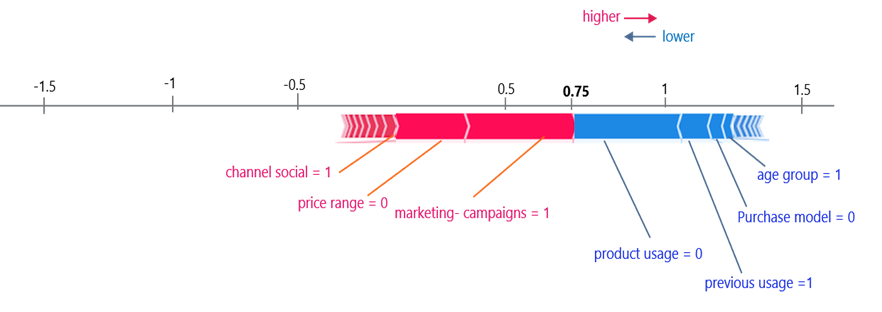
SHAP framework helps implement XAI, move from the black box AI to interpretable AI, thereby allowing the models to earn the trust of users.
[/fusion_text][/fusion_builder_column][/fusion_builder_row][/fusion_builder_container]


